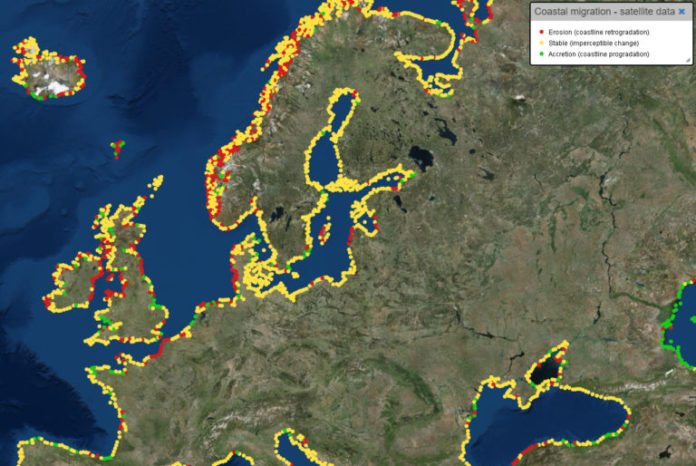
A map which shows the rate at which European coastlines are changing has been released by the European Marine Observation and Data Network (EMODnet).
The shoreline is constantly modified by wind, waves and tides, and impacted by human activity. Climate-driven changes such as sea level rise, higher waves and changes in the wind direction put increasing pressure on many of Europe’s shorelines. Professor Moses has been working with the Geological Survey of the Netherlands on the interpretation of coastal data used to develop the map.
Knowing how and at what rate our coasts are changing is the first step to successfully managing them.
Professor Cherith Moses, Head of Geography at Edge Hill University who helped to produce the map says
“The EMODnet Geology shoreline migration map allows users to look at coastal behaviour from 2007 to 2017 at different spatial scales. It shows where the sea is migrating inland, due to submergence or erosion of the shoreline, where it is stable, and where the shoreline is pushing out into the sea (accretion or emergence).
International policy makers can use the map to determine large-scale coastal vulnerability while national and regional coastal managers will use it to identify potential areas of rapid change. The maps also provide the general public with a useful insight into one of Europe’s most obvious climate change effects.”


